Analytics by group: see all your brands and markets in one view
Switch your portal to All to see return rates, product performance and revenue for your whole group, and pick exactly which storefronts to include.
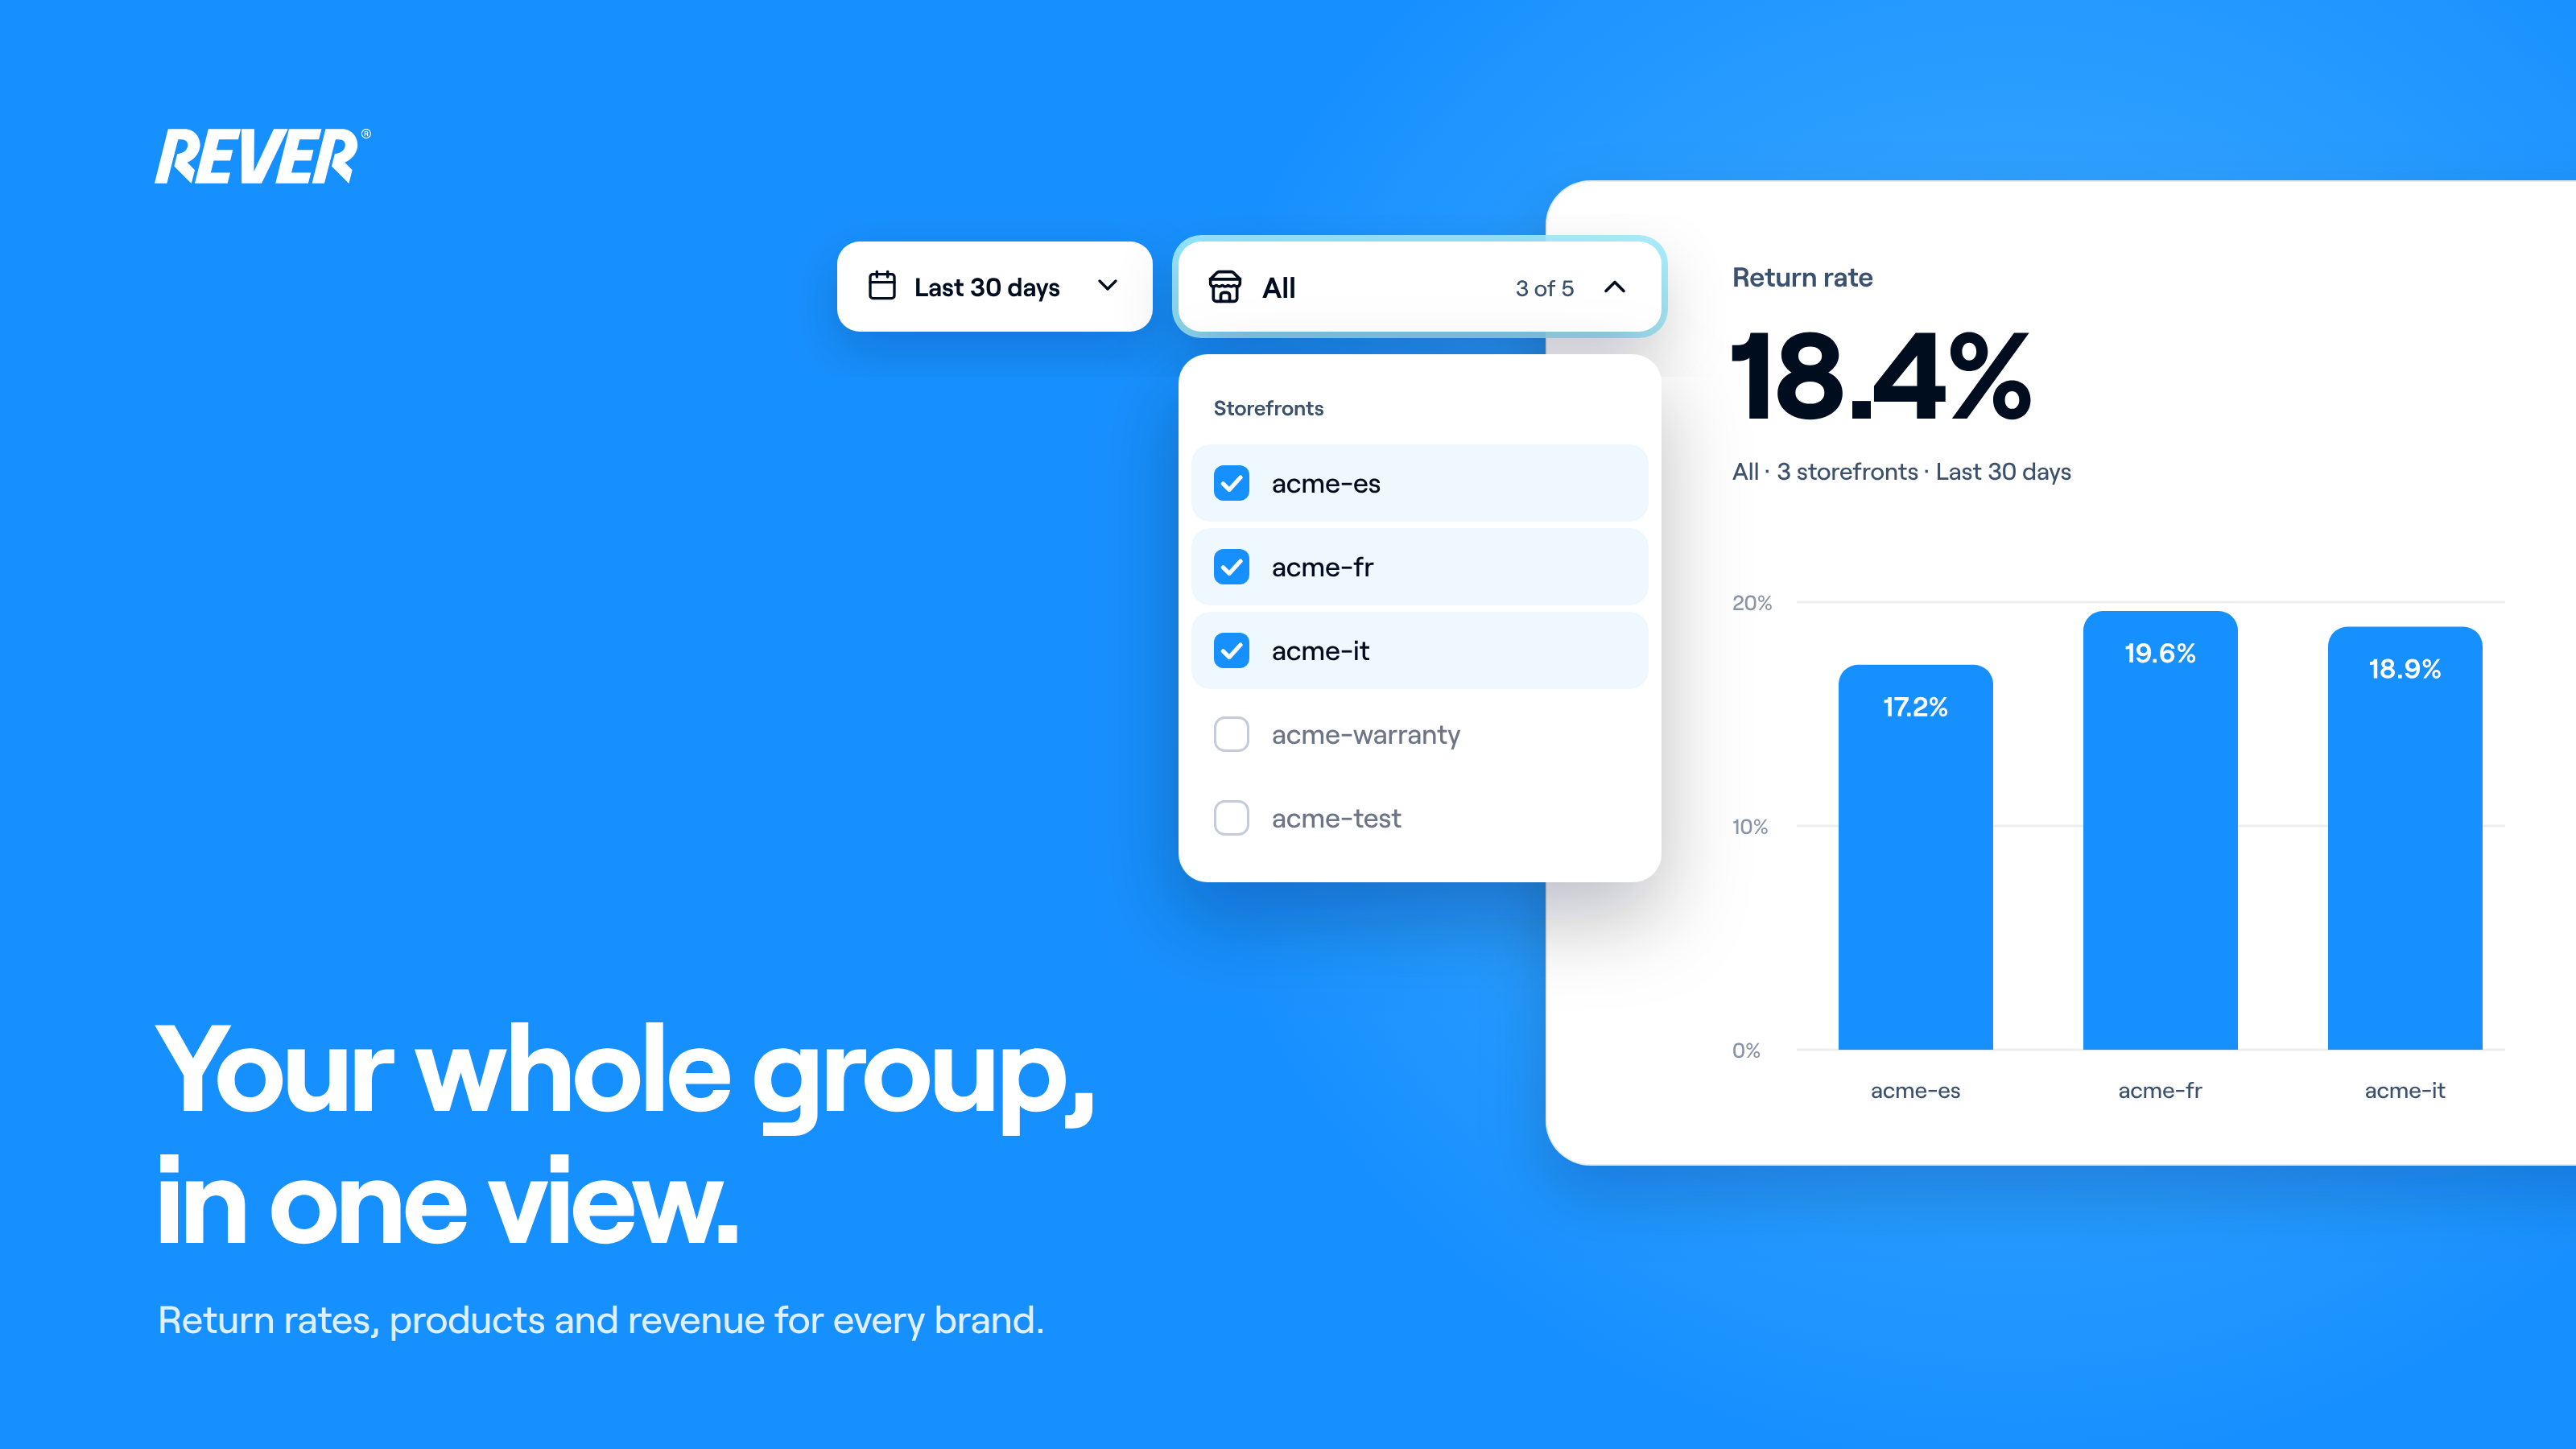
This one is for those of you running several brands or markets on REVER: you can now see how your whole group is performing in one place.
Introducing: Analytics by group
How does it work?
Switch your portal to All and the Dashboard aggregates every storefront in your group: return rates, product performance and revenue, calculated for the whole group at once. Everything else works exactly as usual.
Can I choose which portals to include?
Yes. A new portal selector next to your filters lets you toggle individual storefronts on or off, so you can leave out internal, warranty or test portals that distort your real figures. Your selection follows you across every analytics tab and is saved for your next session.
When can I use it?
It's live today in your Dashboard. If you have questions, just let us know.